Monitor buildings with Data Analysis and Reporting Software
During their life cycle, real estate and infrastructure generate vast amounts of data, often considered true “big data” due to their quantity and complexity.
Infocad produces and records on databases a growing amount of information related to real estate and infrastructure assets: fault tickets, scheduled maintenance actions, asset status, environmental comfort parameters, and more.
The software is the ideal tool for analyzing and enhancing this data, providing a solid basis for a complete and up-to-date knowledge of the heritage and related technical services.
Scarica la scheda tecnica Analisi e Report
Compila il seguente form per scaricare la scheda tecnica Analisi e Report

Analyses the functionalities of Infocad Data Analysis Software
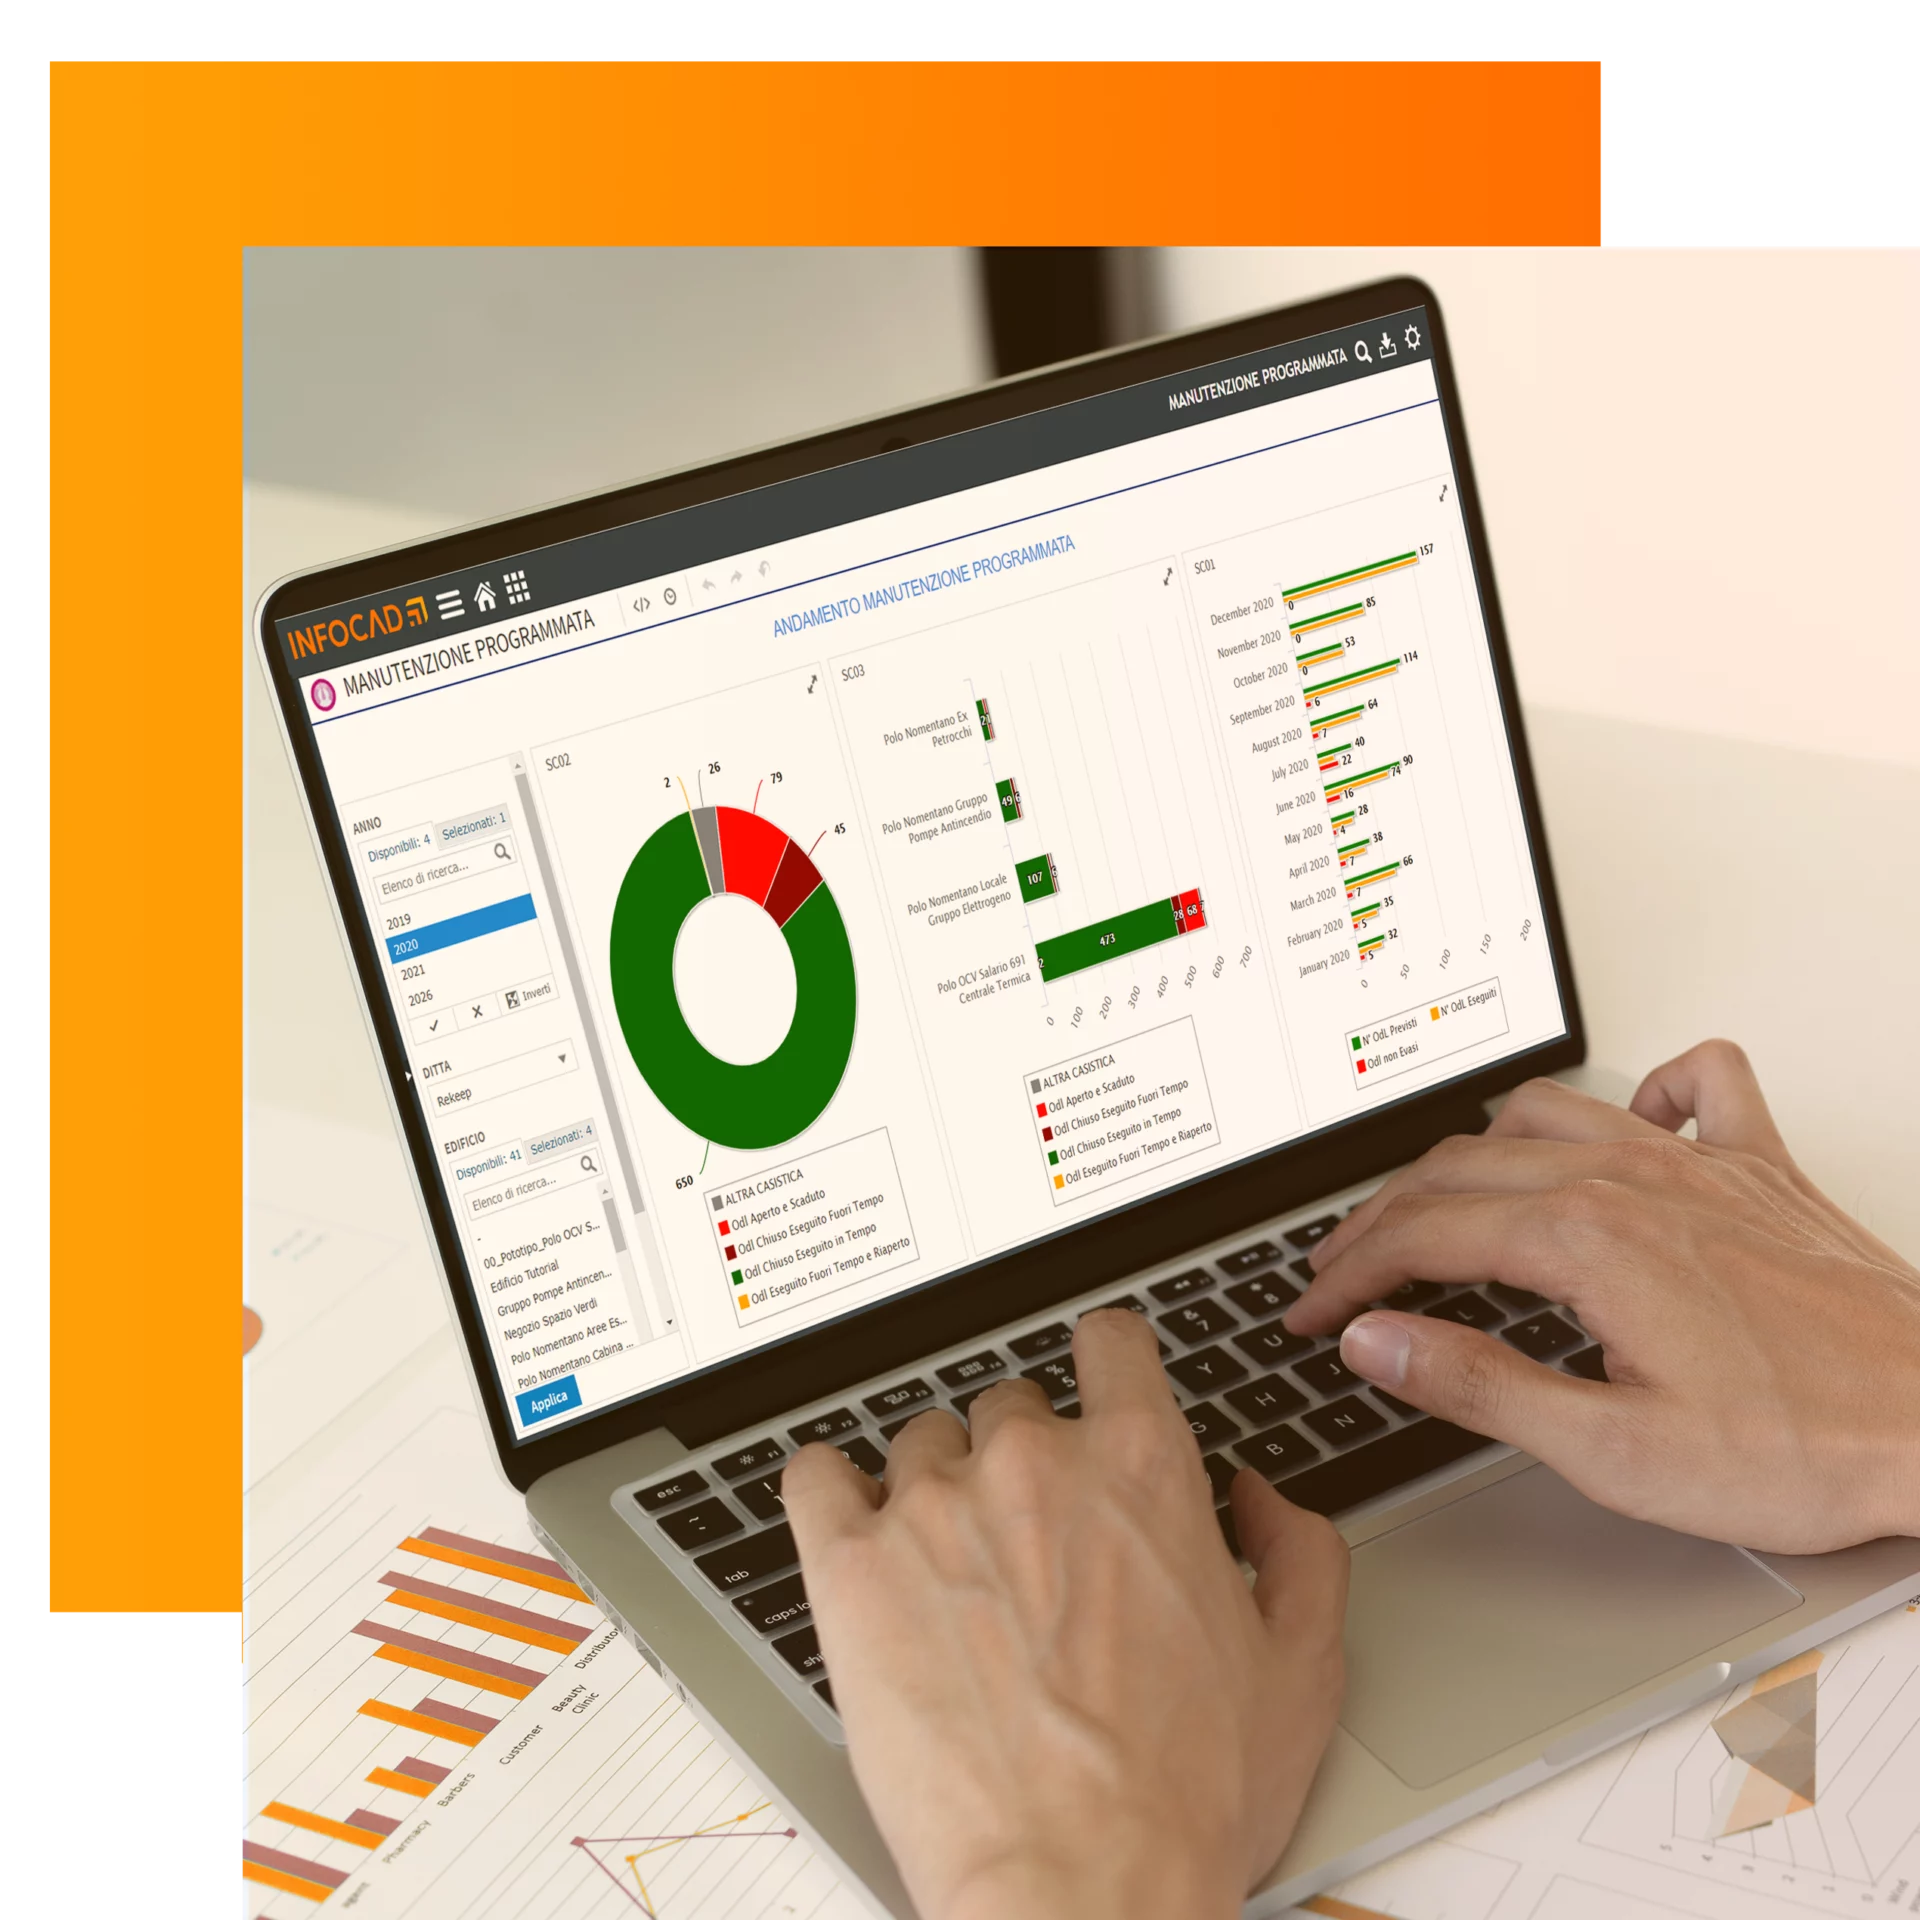
Access the data you are interested in with one click.
The platform provides an optimized user experience, enabling users to navigate through real estate and infrastructure asset information with ease.
With a single click, users can quickly access relevant data, which are presented in a clear and organized manner for immediate reference.
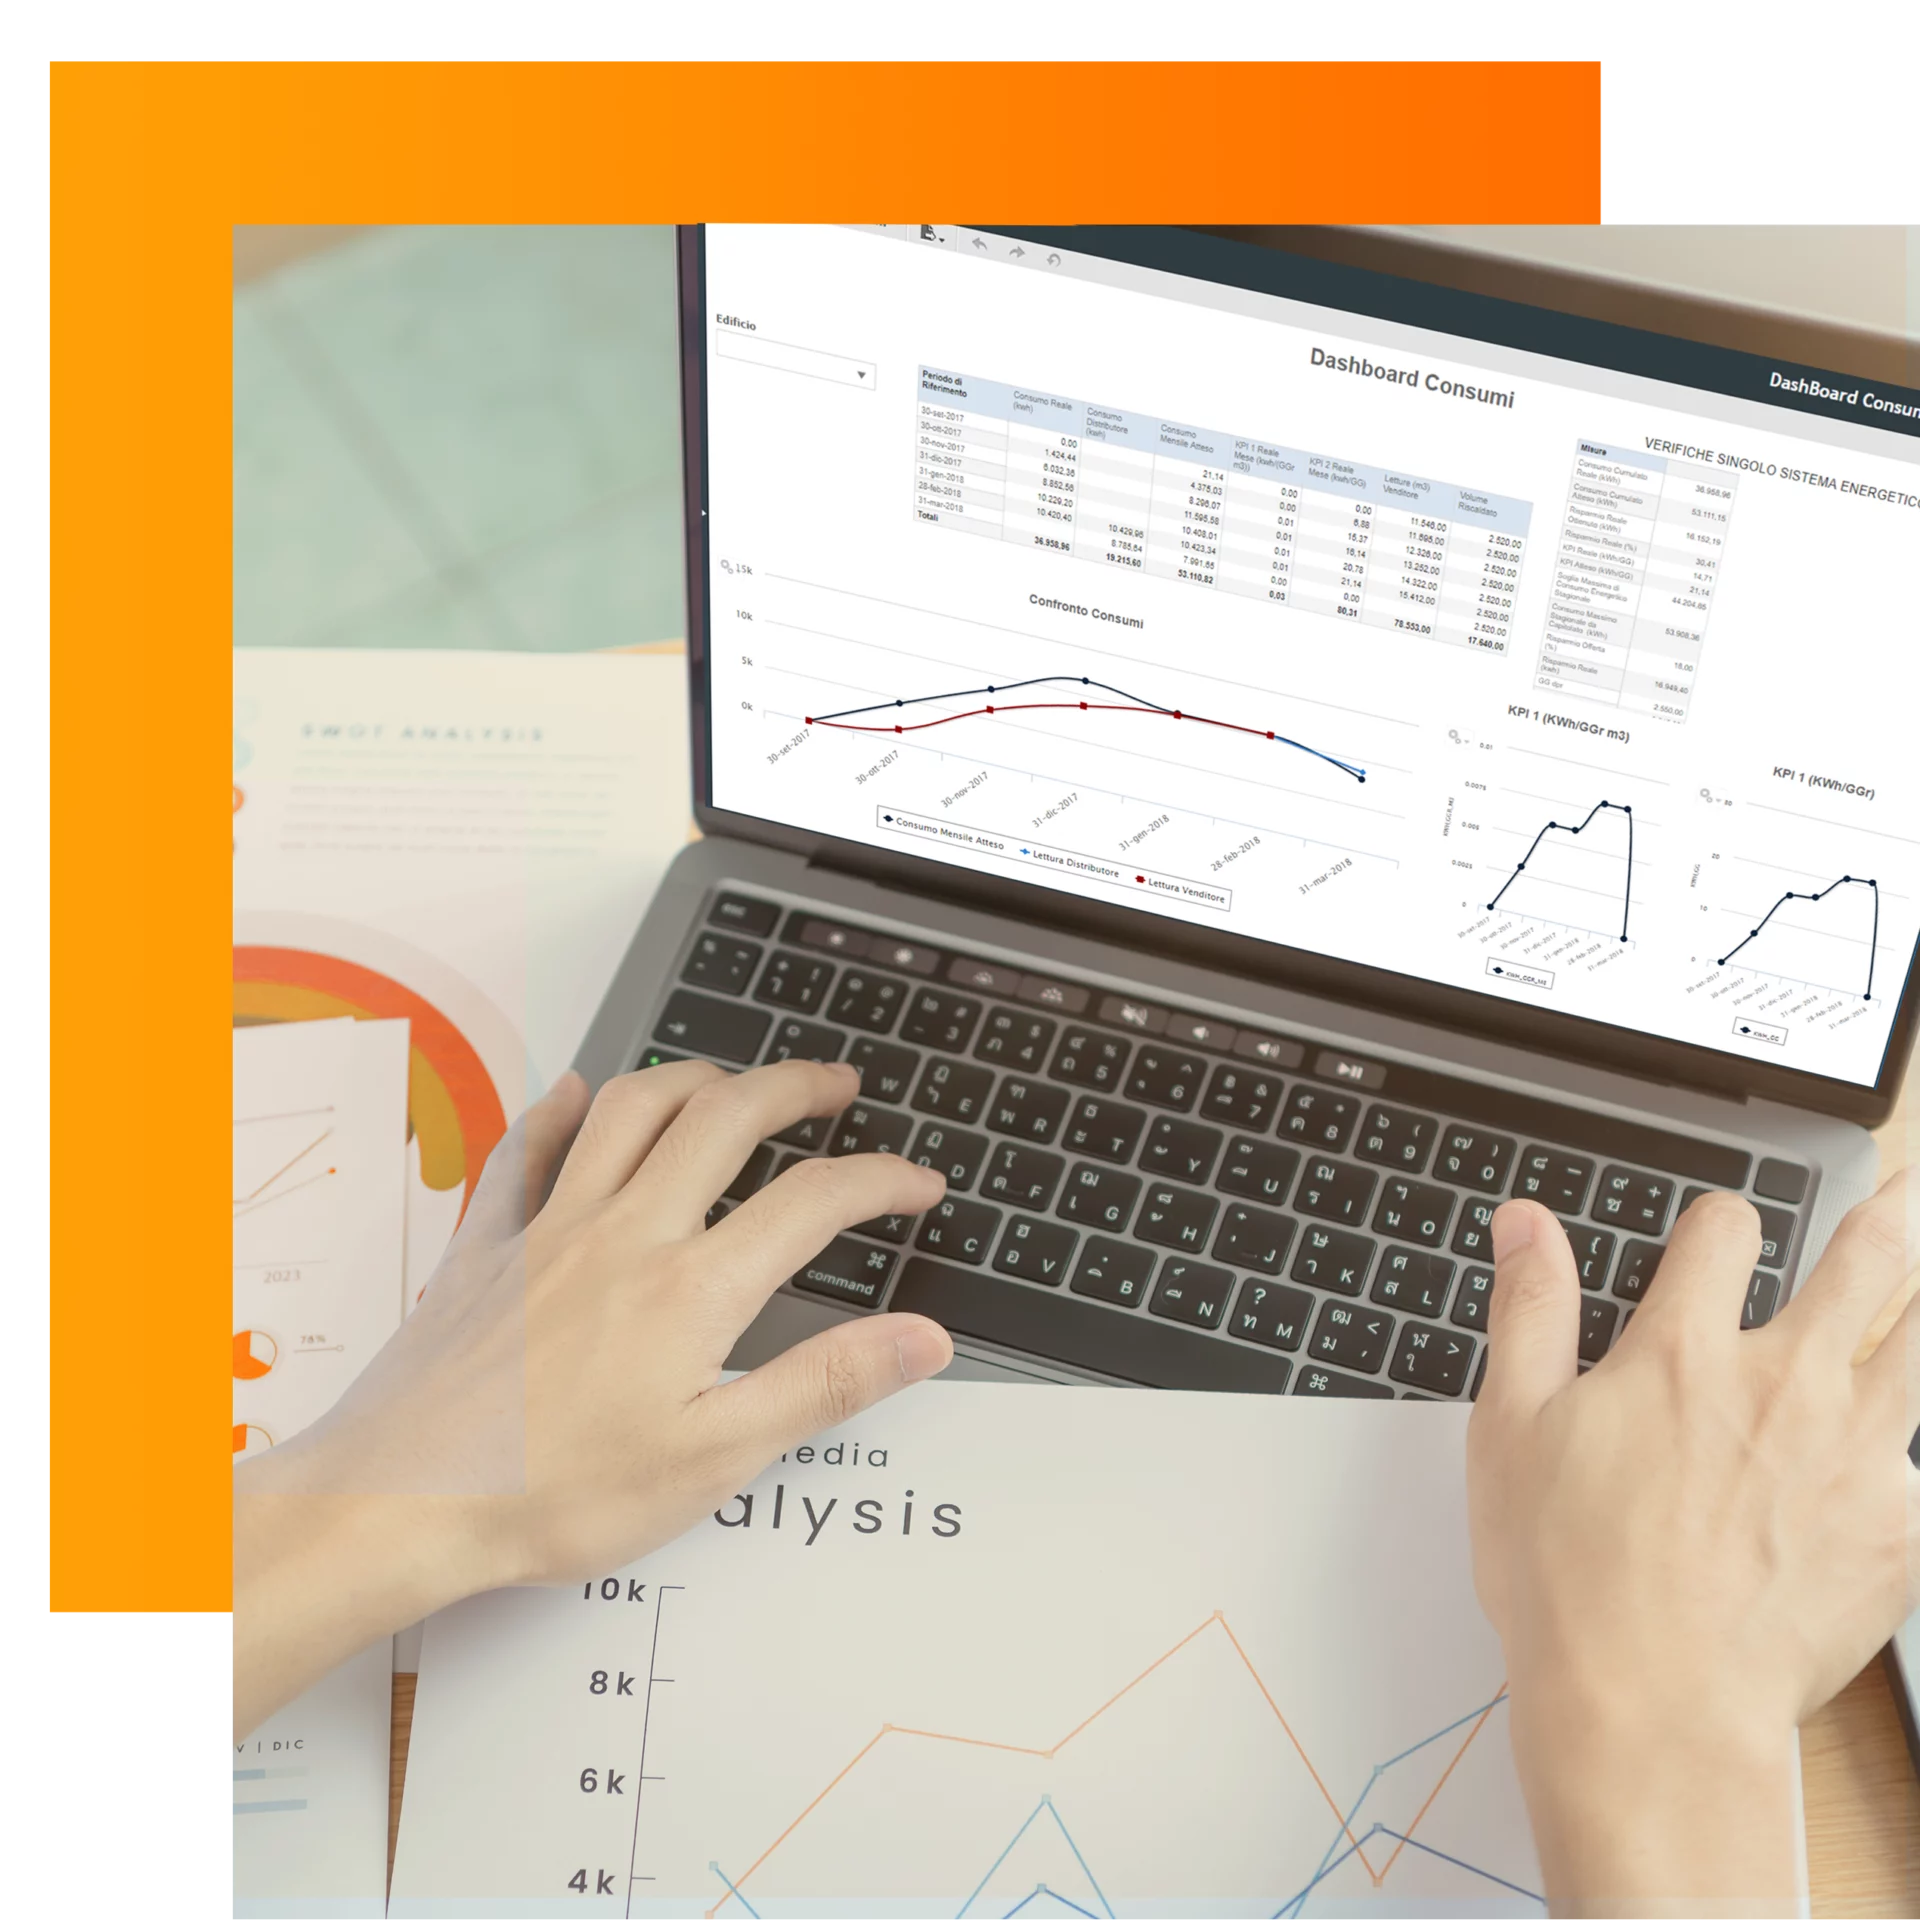
Take advantage of the simplicity of the interface to perform analysis
complex.
Despite the complexity of the data handled, the user-friendly interface allows in-depth analysis to be conducted with ease.
With intuitive tools and advanced features, you can explore data, identify trends and correlations, and gain valuable insights with just a few clicks.
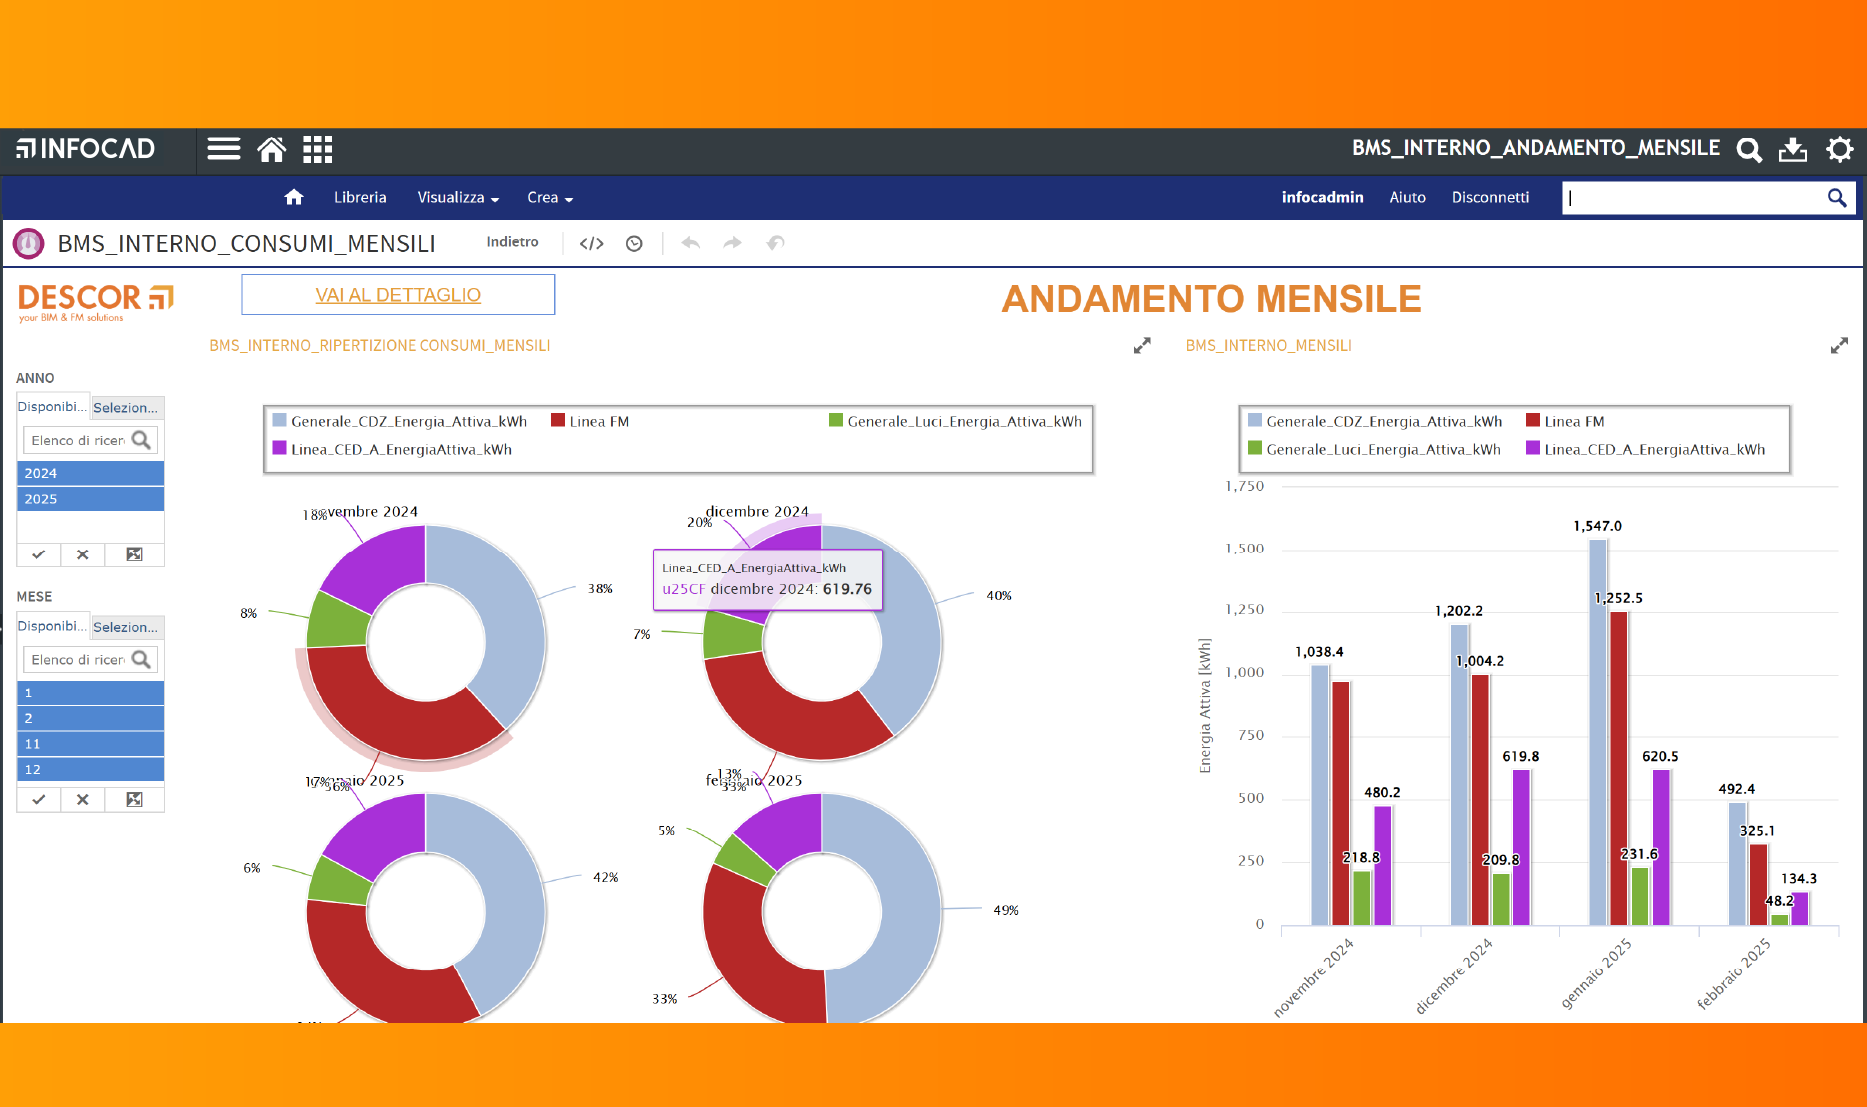
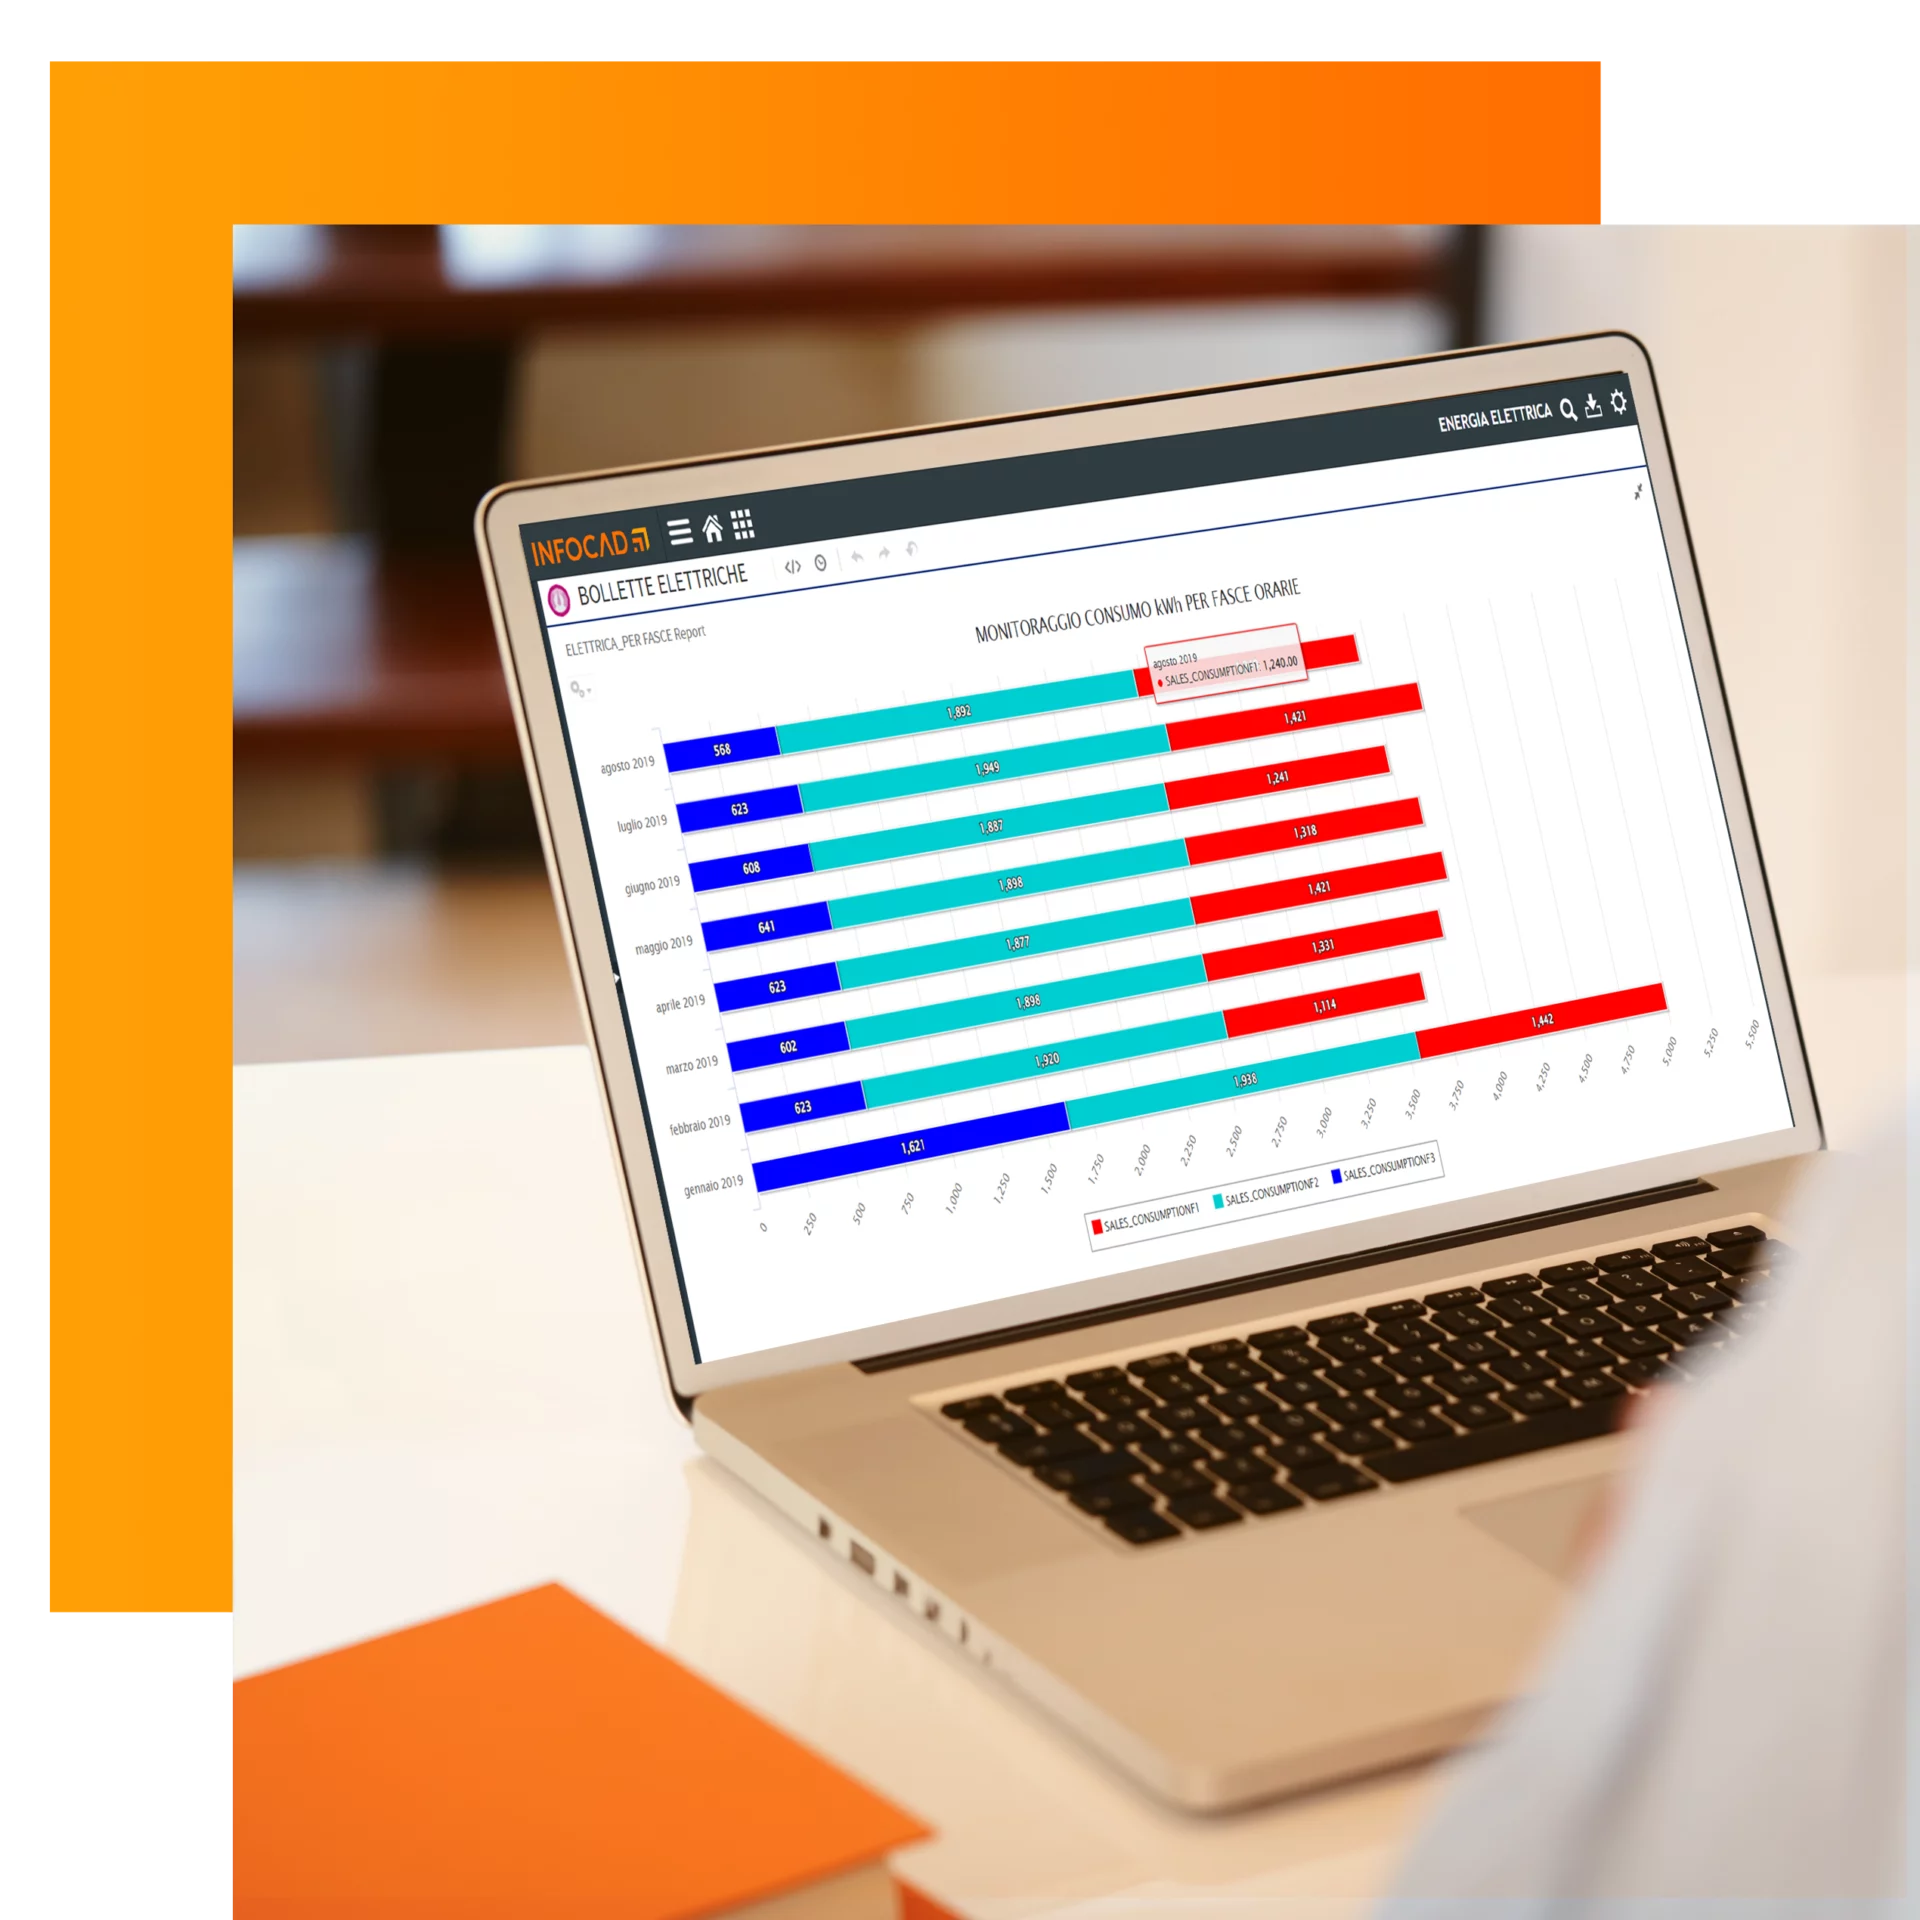
Select the type of chart best suited to your purposes.
With its wide range of data visualization options, you can choose from different types of graphs, bar, pie, scatter, line, and many others.
This flexibility allows you to represent your data clearly and effectively, highlighting significant trends, patterns and relationships visually and immediately.
By choosing the right type of chart, you can communicate your analysis effectively and make informed data-driven decisions.
Access the data you are interested in with one click.
Take advantage of the simplicity of the interface to perform analysis
complex.
Select the type of chart best suited to your purposes.
Bringing technology to your side
Simple and secure
Interactive graphs
Interactive reports
Semplice e sicuro
Grafici interattivi
Report interattivi
Infocad always with you
With the App Infocad, you can have your company reports and data at your fingertips anytime, anywhere. With this convenient mobile solution, you can easily access crucial information, such as key performance indicators, financial analysis and operational metrics, without the need to be physically in the office.
Fill in the form and request a free live demo
Request a free live demo
Fill in the following form and you will be contacted immediately to book a personalised platform presentation:
FAQ - Frequently Asked Questions
Data analysis software is a computer platform designed to examine, interpret and understand large amounts of data in order to extract meaningful information and support business decisions.
A reporting software is an IT platform designed to generate, visualise and distribute reports and information documents based on company data.


